
Search Homes
What’s My Home Worth?
Book an Appointment

Cash Offer or List Your Olney–Logan Home? What You Actually Keep
If you can wait for a normal sale and your home can be shown, listing it in Olney–Logan will almost always put far more money in your pocket than a cash offer — on the illustrative example below, the gap is about $41,000. The data sites track Olney and Logan as two separate markets, and they sell at different speeds — Olney in about six weeks, Logan in about ten — so a single “North Philly number” misprices both. This corridor is also my own working ground: my current listing, a $499,999 triplex at 5923 N Broad St, sits right on the Broad Street spine between the two. A cash offer makes sense when speed or certainty matters more than price: a hard deadline, a home that needs major work, an estate you need closed. The right answer depends on your neighborhood and your deadline — and you should see both numbers before you decide.
I’m Robert Travers of The Robert Travers Team, Long & Foster Real Estate — 300+ homes sold, including 91 career list-side closings in Philadelphia, and REO and investor-side work since I was licensed in 2010. I’m currently listing a $499,999 triplex at 5923 N Broad St — multi-family and investor sales in this city are my day-to-day work. Olney’s median sale price over the last 12 months is $185,000 across 229 sales, with just 2.7 months of inventory; Logan’s is $167,500 across 116 sales, with 4.0 months. (No year-over-year percentage is claimed for either: the portal’s own sets flip the sign on both neighborhoods.) Bring me any cash offer you’ve received and I’ll put the list-side number next to it — free, no obligation.
Olney–Logan, honestly
Olney–Logan is North Philadelphia along Broad Street: Olney’s two-story rows around Olney Avenue and the North 5th Street commercial corridor, Fisher Park and Tacony Creek, and Logan’s 1930s twins and rows split by Broad between La Salle University and Jefferson Einstein Philadelphia Hospital. This page also covers sellers in Feltonville, Fern Rock, Hunting Park, East Oak Lane, and Ogontz. The honest split is speed as much as price: Olney moves in about 42 days with 2.7 months of supply — seller’s-market mechanics — while Logan moves in about 68 days with 4.0 months. A cash buyer quoting Logan’s slower pace to an Olney seller, or Olney’s median to a Logan twin, is discounting you off the wrong market. Price yours from your own side of the corridor.
• Olney median sale price, trailing 12 months: $185,000 (Homes.com market data); single-family median $228,500; townhouse median $190,000; median list price $194,950; about 42 days to sell; 229 sales; 2.7 months of supply.
• Logan median sale price, trailing 12 months: $167,500 (Homes.com market data); single-family median $186,000; townhouse median $165,000; median list price $165,000; about 68 days to sell; 116 sales; 4.0 months of supply.
• No year-over-year percentage is claimed for either neighborhood because the portal’s own data sets disagree on the direction for both.
A cash buyer’s discount comes straight off numbers like these.
The two paths, side by side (illustrative example)
| Cash offer | Listed with Robert Travers | |
|---|---|---|
| Price | Typically 60–80% of market value — a range one Pennsylvania buyer’s own website publishes | Full market exposure, priced from your own neighborhood’s closings — Olney as Olney, Logan as Logan |
| Your net | No commission — but the discount is the fee; it’s just invisible | Sale price minus commission and closing costs, shown up front on a net sheet |
| Timeline | Close in about 7–14 days | About 6 weeks on market in Olney and about 10 weeks in Logan at the current average paces, plus 30–45 days to close |
| Repairs | None | Only what pays for itself — I advise, you decide |
| Showings | None | Managed around your schedule — and around your tenants, if you have them |
| Certainty | High — if the buyer performs | Contract with verified buyers; I manage the risk |
| Representation | None. The buyer is the other side. | A Realtor with a legal duty to YOUR price — and the Sales Manager of the Long & Foster Havertown office |
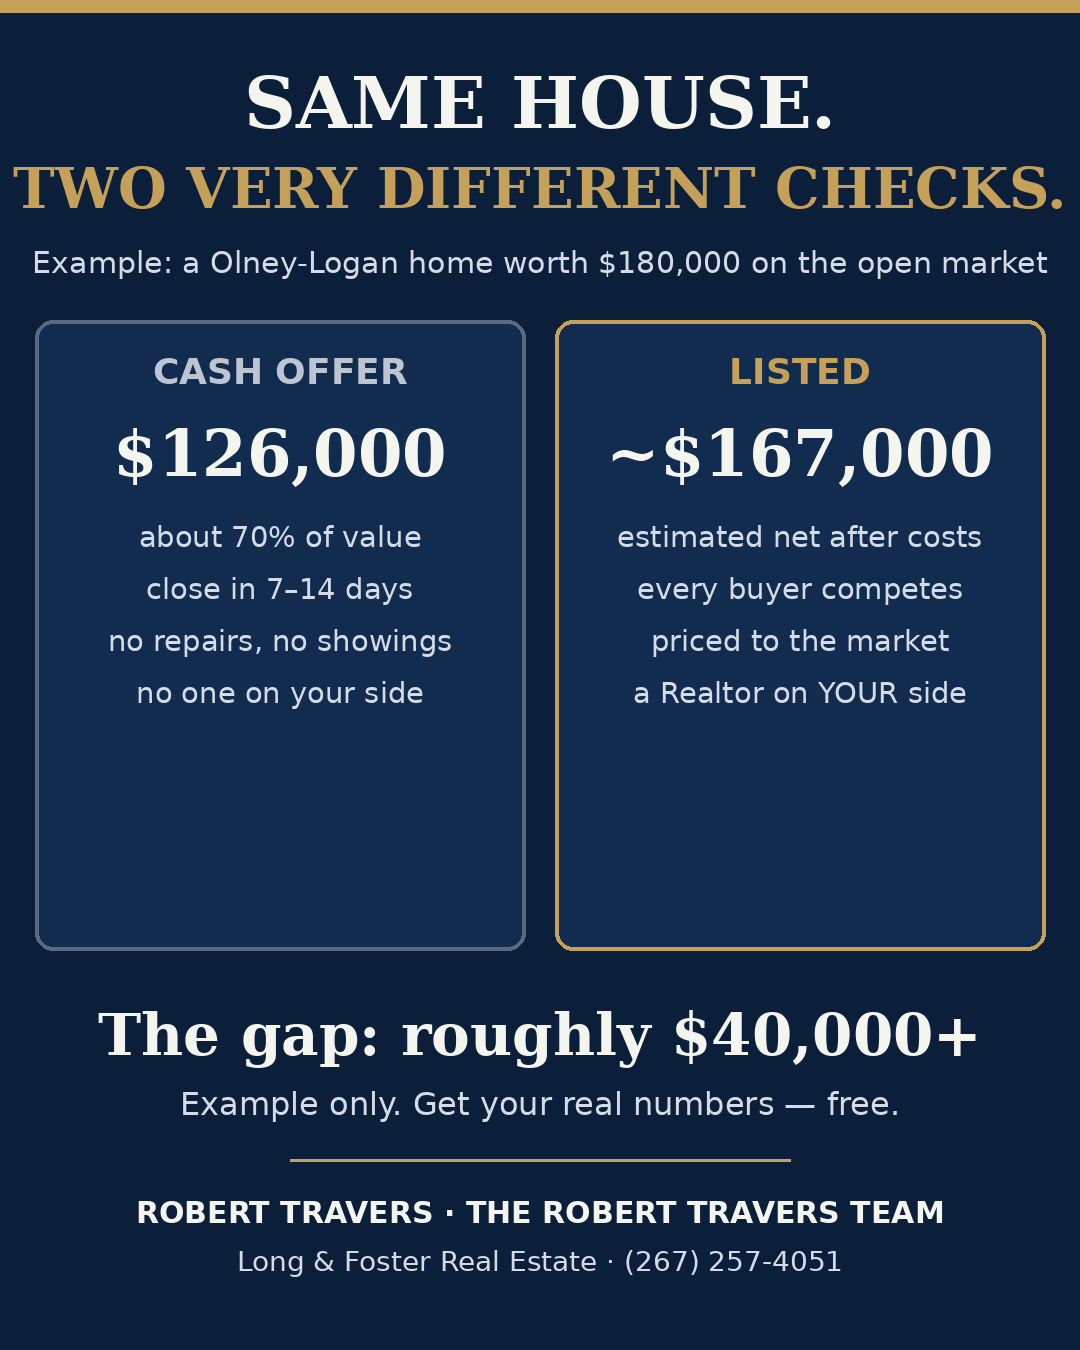
Example (illustrative, not a promise): on an Olney–Logan home worth $180,000 on the open market — illustrative, between Olney’s $185,000 median and Logan’s $167,500 median — a cash offer at 70% is $126,000. Listed and sold at market, even after commission and typical seller costs, the same home nets roughly $167,000. That gap — about $41,000 — is the real price of “fast.” Sometimes it’s worth it. You should just never pay it without seeing it.
When a cash offer is the right call
- A deadline that truly cannot move: foreclosure date, relocation start, court or estate timeline
- Major systems failed — roof, sewer, structure — with no ability to fund repairs
- An inherited home out of state that needs to be closed and done
- A tenant situation you want ended, not managed
If that’s you, take the offer — but get one competing number first. A second cash bid and a list-side estimate cost you nothing and regularly change the outcome.
When listing wins
- You have 72–113 days of flexibility — from Olney’s 42-day pace to Logan’s 68-day pace, plus closing time
- The home is livable, even if dated — renovated Olney and Logan rows pull owner-occupant prices, not wholesaler prices
- You’re a landlord exiting: list it to the whole investor pool along the Broad Street corridor, not the one wholesaler who knocked
- An estate or family can wait for the stronger number
- You want the whole market bidding, not one buyer pricing in the dark
Bring me any cash offer
Already have one? Send it to me. I’ll run the comparable sales and hand you a net sheet: the cash number, and the likely list number after all costs. If the cash offer is genuinely your better move, I’ll tell you — my name is on that advice either way.
Olney–Logan seller FAQs
Cash buyers commonly pay 60–80% of market value. Around Olney’s $185,000 median and Logan’s $167,500 median, that’s often $34,000–$56,000 below a market sale. The exact gap depends on which side of the corridor your home sits — get both numbers for your house.
Olney: about 42 days on average over the last year (Homes.com), with 229 homes sold and 2.7 months of inventory. Logan: about 68 days, with 116 sold and 4.0 months. Correct pricing is what puts a home in the fast group in either market — overpriced homes sit in both.
List it, almost always. Investor demand along Broad Street is deep and competitive — the same buyers who wholesale will bid against each other on the open market. I list tenant-occupied properties regularly — my current listing is a $499,999 triplex at 5923 N Broad St, in this corridor — and handle showings around your tenants.
No. We can sell with contents in place or coordinate a cleanout — I have local crews and handle this for estates regularly.
Nothing. The net-sheet comparison is free, and there’s no listing agreement attached to it.
Search Homes
What’s My Home Worth?
Book an Appointment
Robert Travers of The Robert Travers Team — Long & Foster Real Estate, 1100 West Chester Pike, Havertown, PA 19083 — (267) 257-4051 — citytosuburbsliving.com